 Entertainment
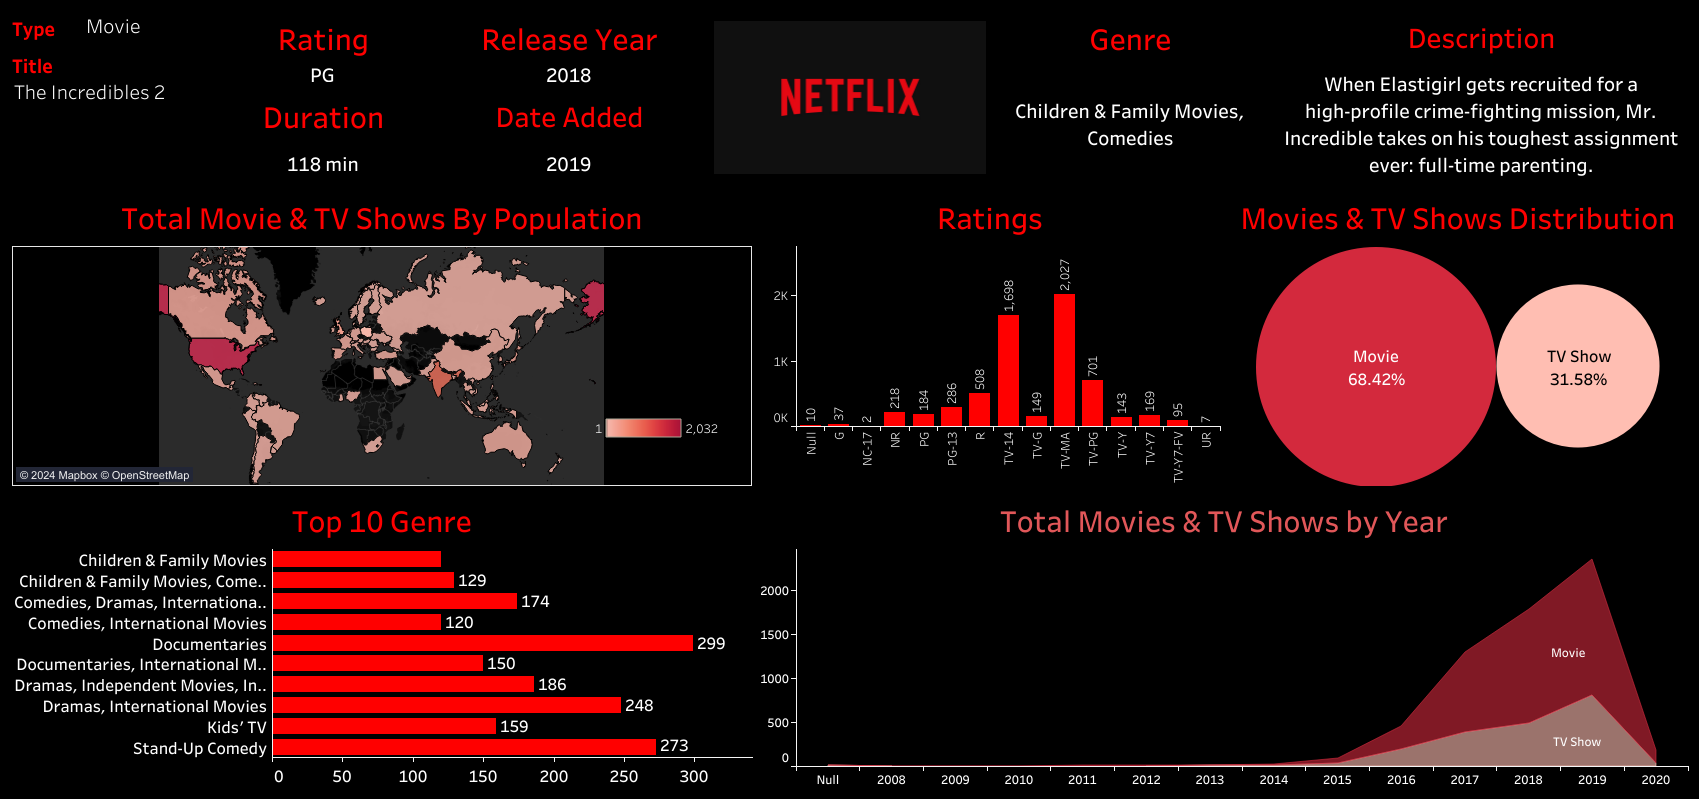
Wanted to find and review the Top Genres that people all over the world watch, and there demographic statistics, based on the data that has been required it has interactive features that can determine its ratings/release year/date added/duration/and more!
View Dashboard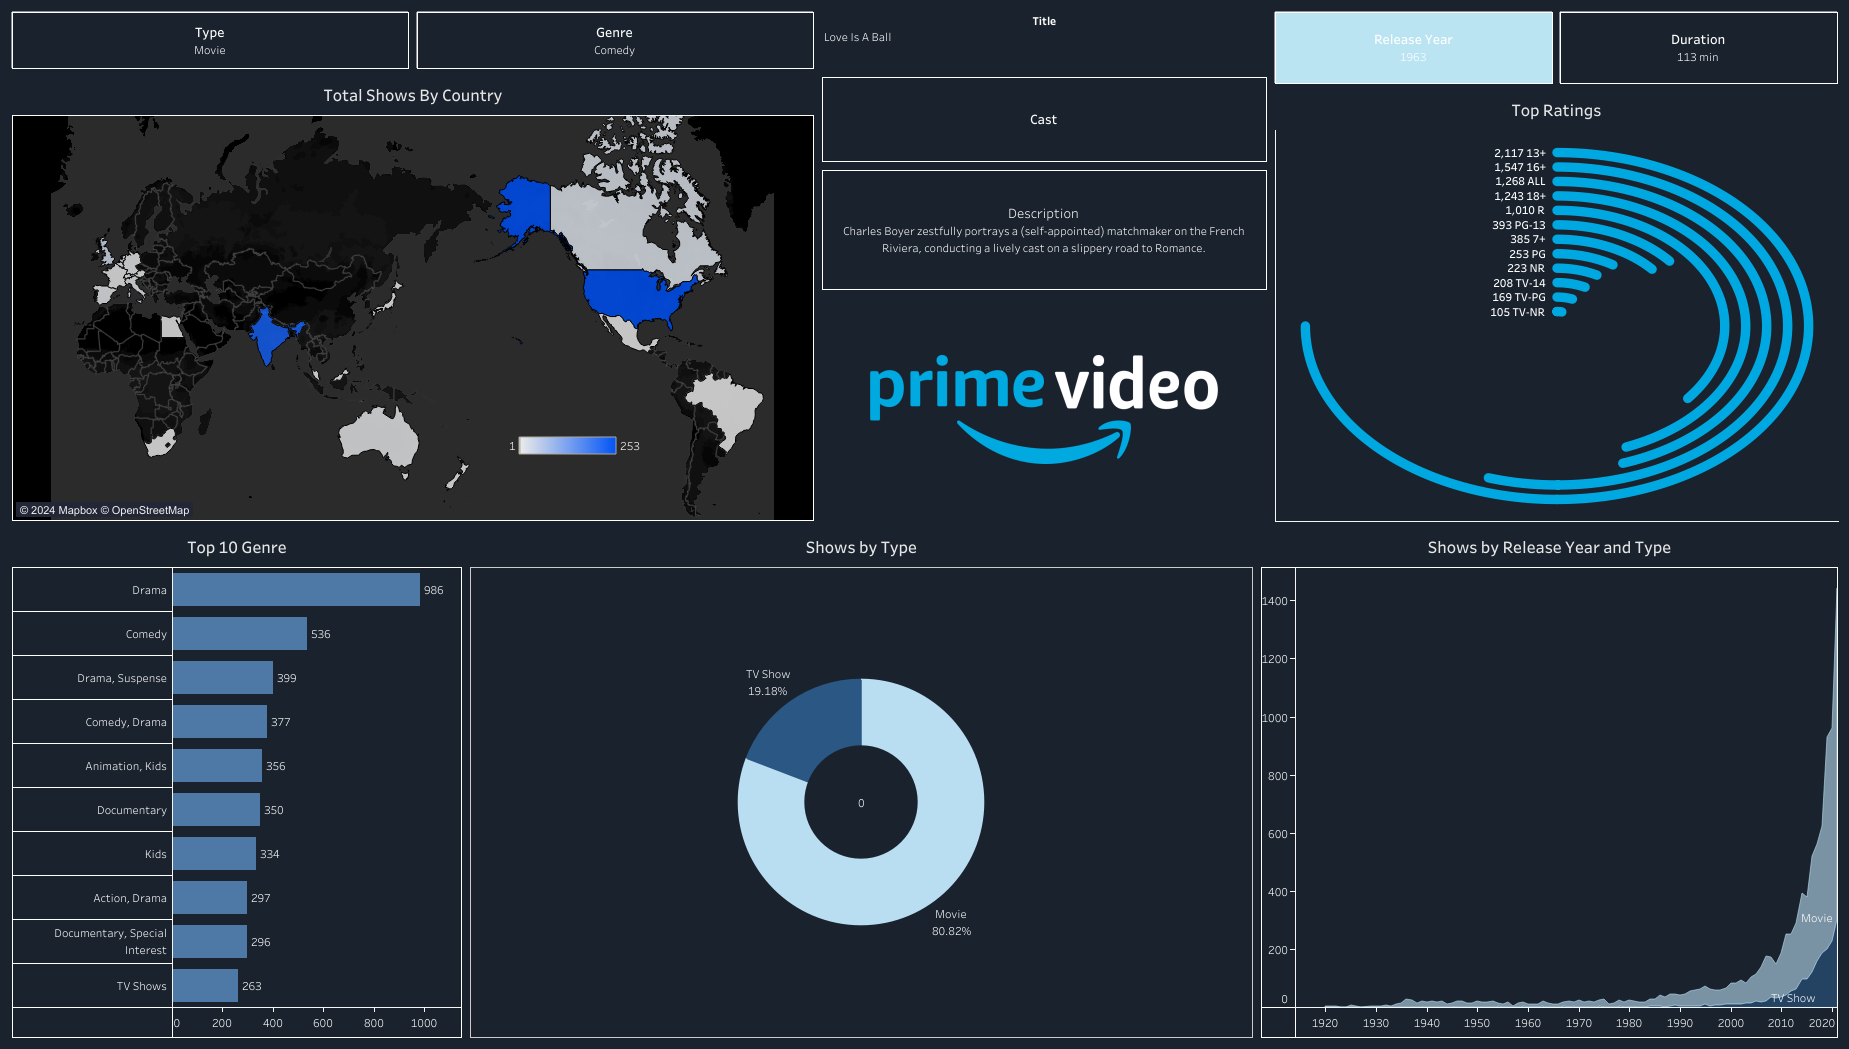 Entertainment
Case Study on Prime Video on the statistics and background on the Top Genres, and population that is viewing around the world, with several different charts/graphs.
View Dashboard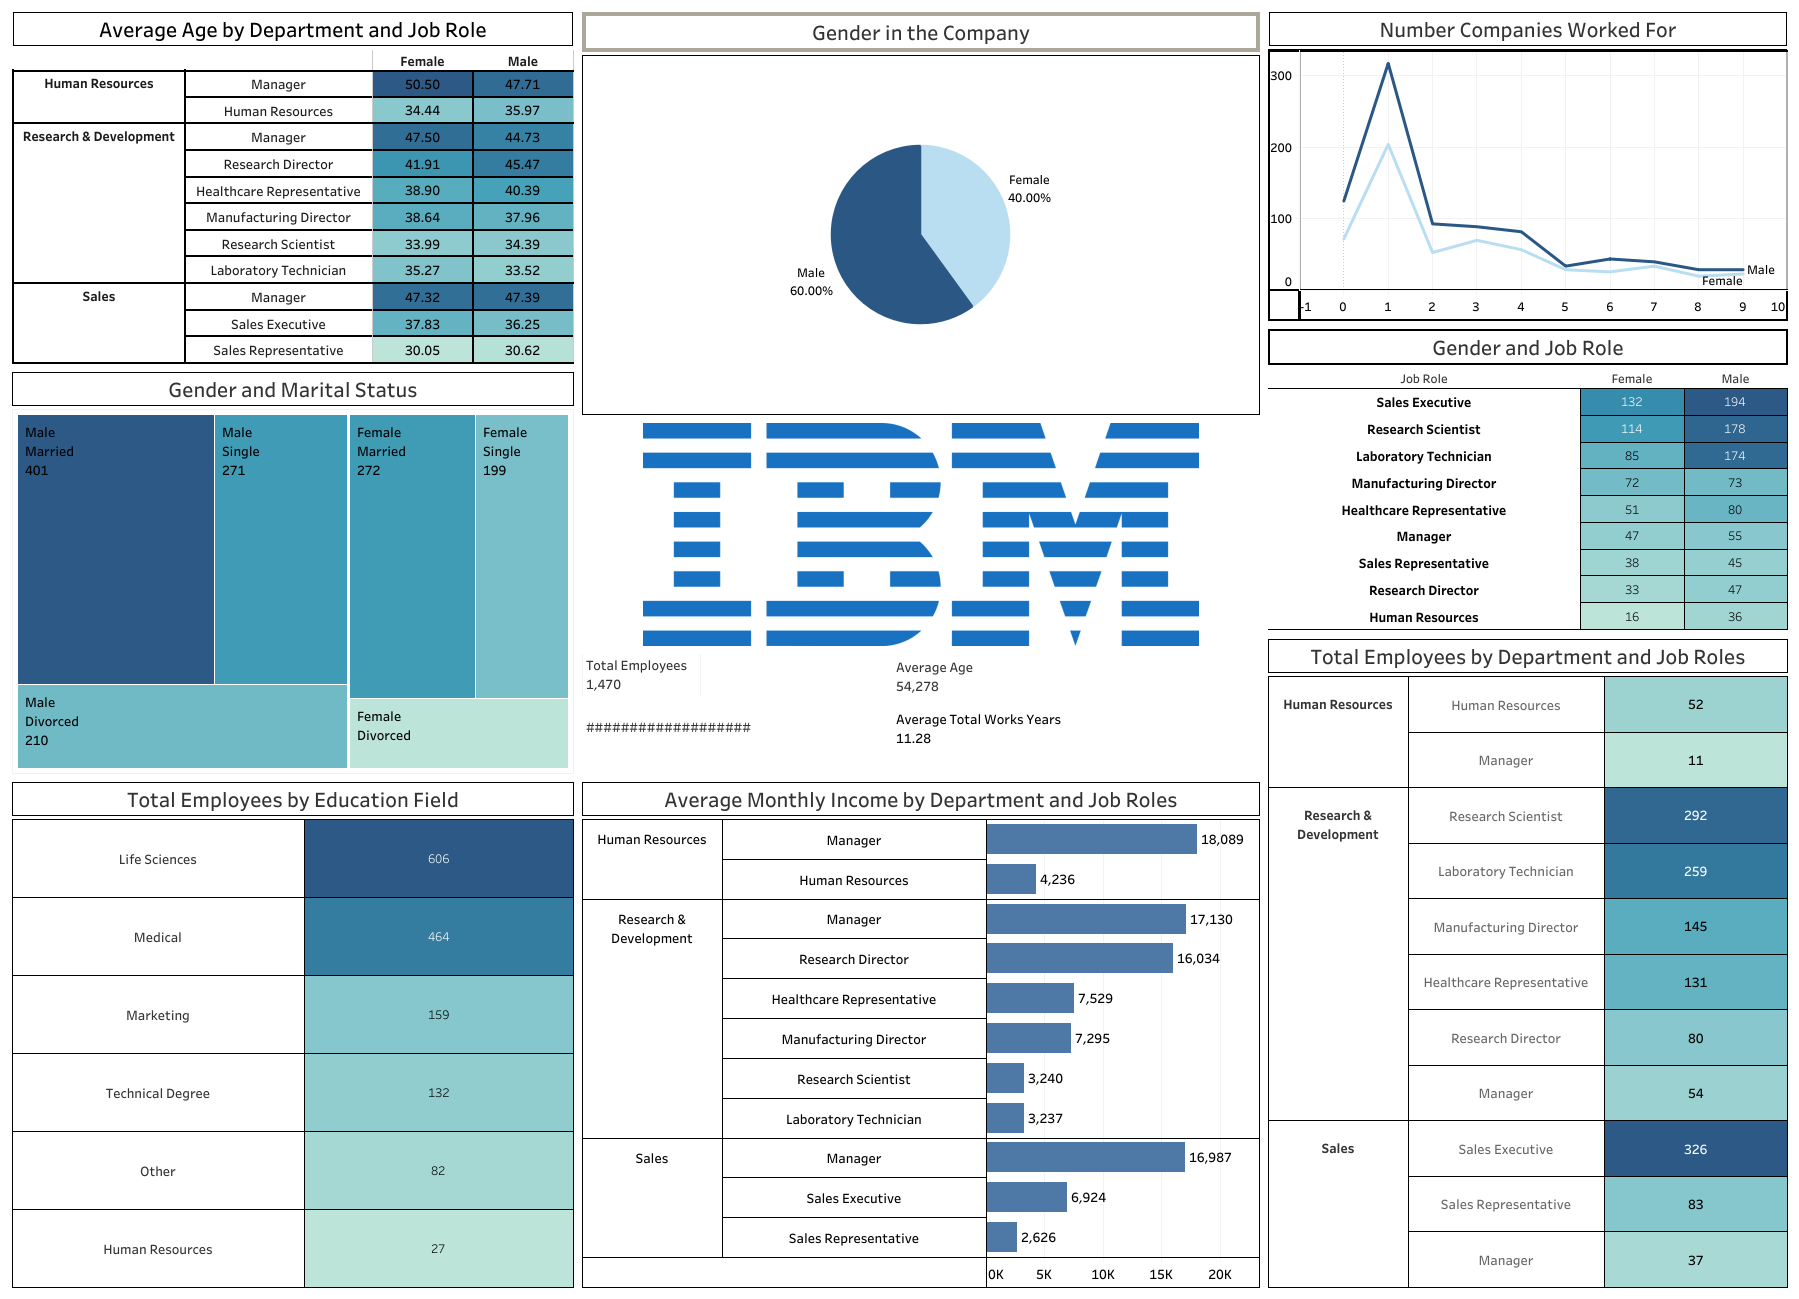 HR & Workforce
This is statistics and findings of researching IBM's company info such as their job rates, and the average amount of years of experience each position has, with several different filters.
View Dashboard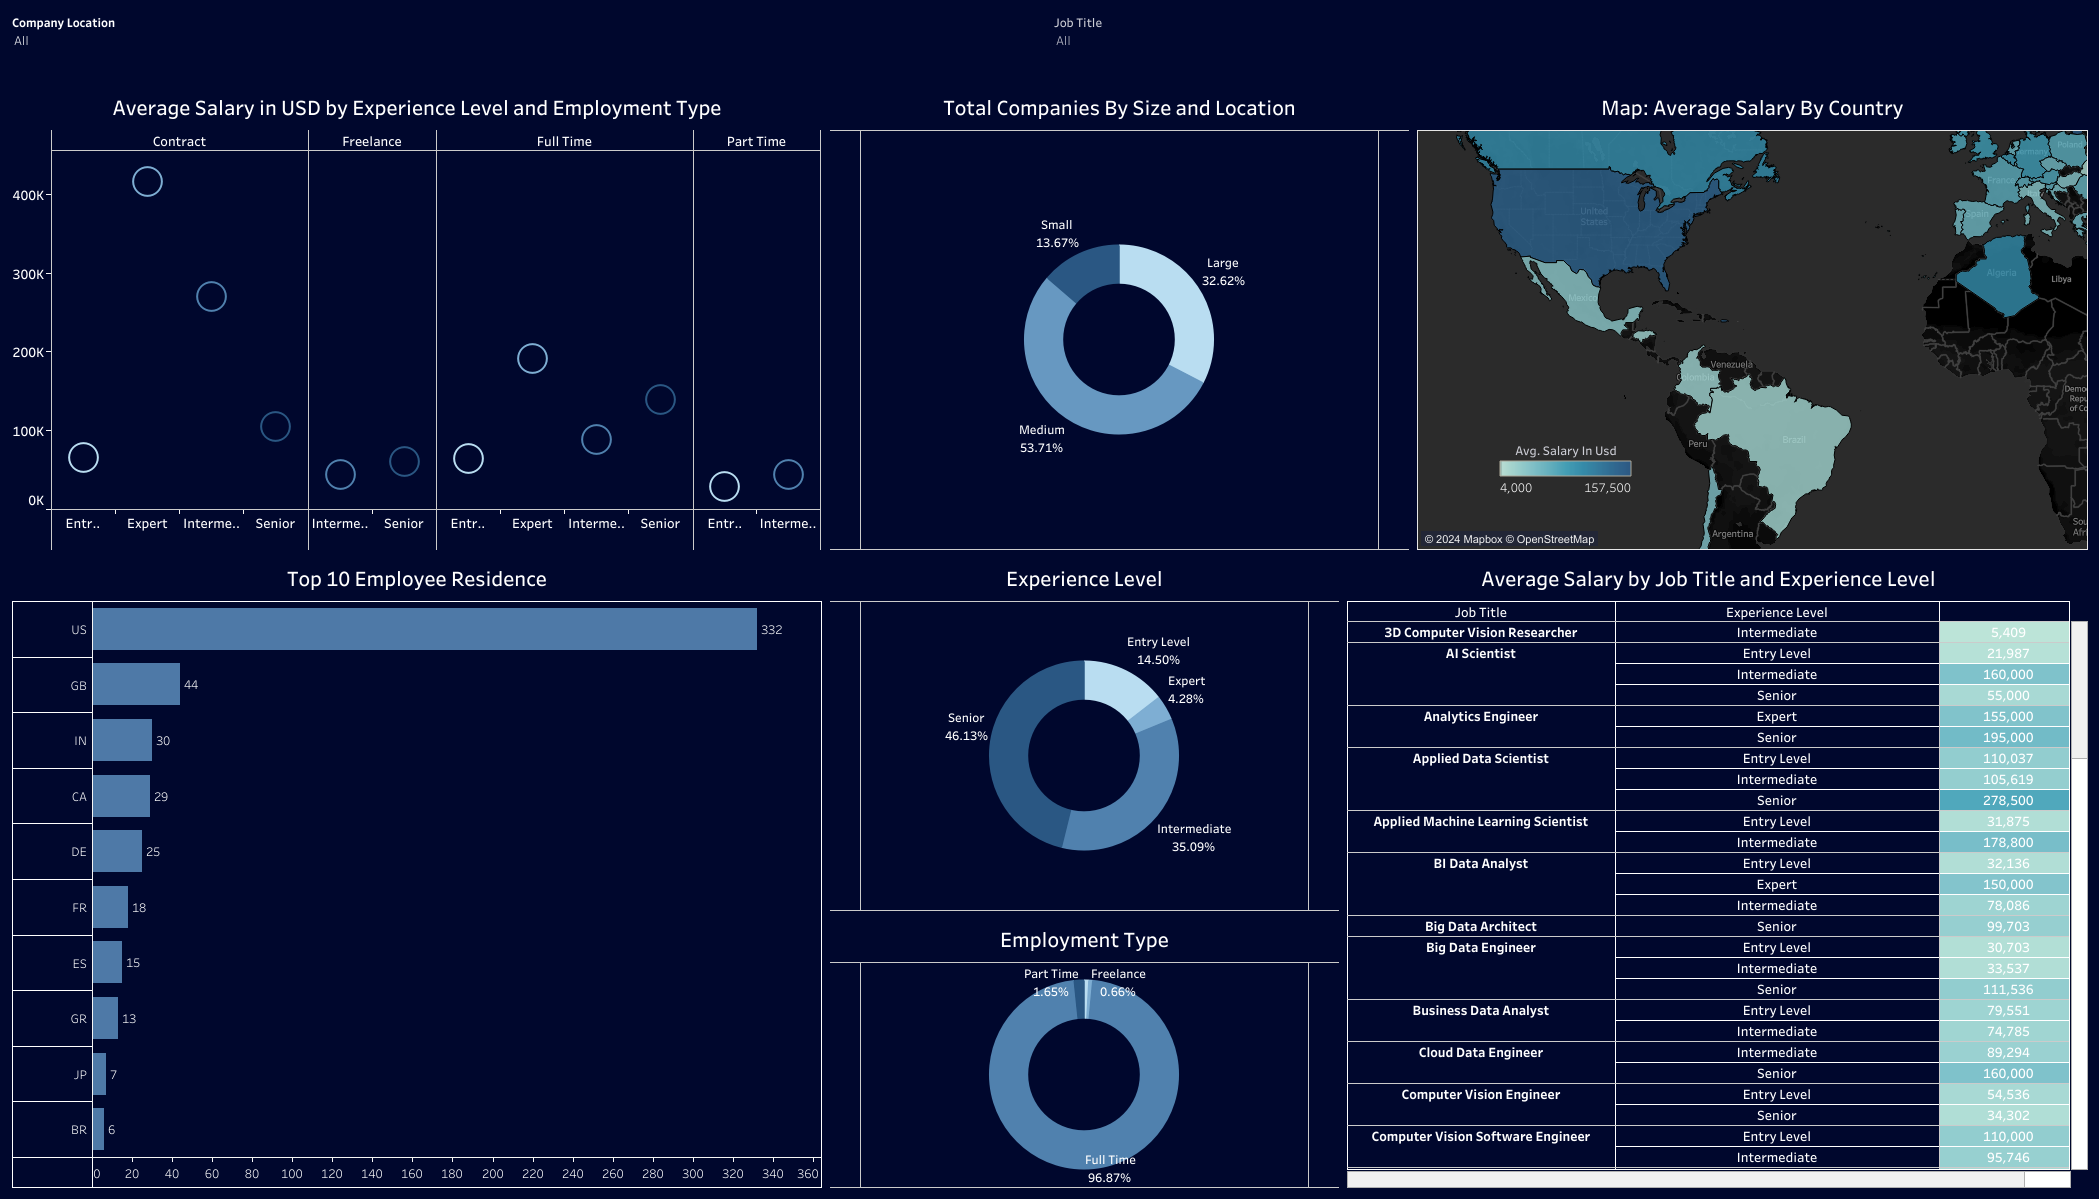 Career & Compensation
Breakdown of different Analyst job salaries around the world. It's always interesting to see how the market and trends are around the world, so this was a great time to look into seeing the world of Analysts!
View Dashboard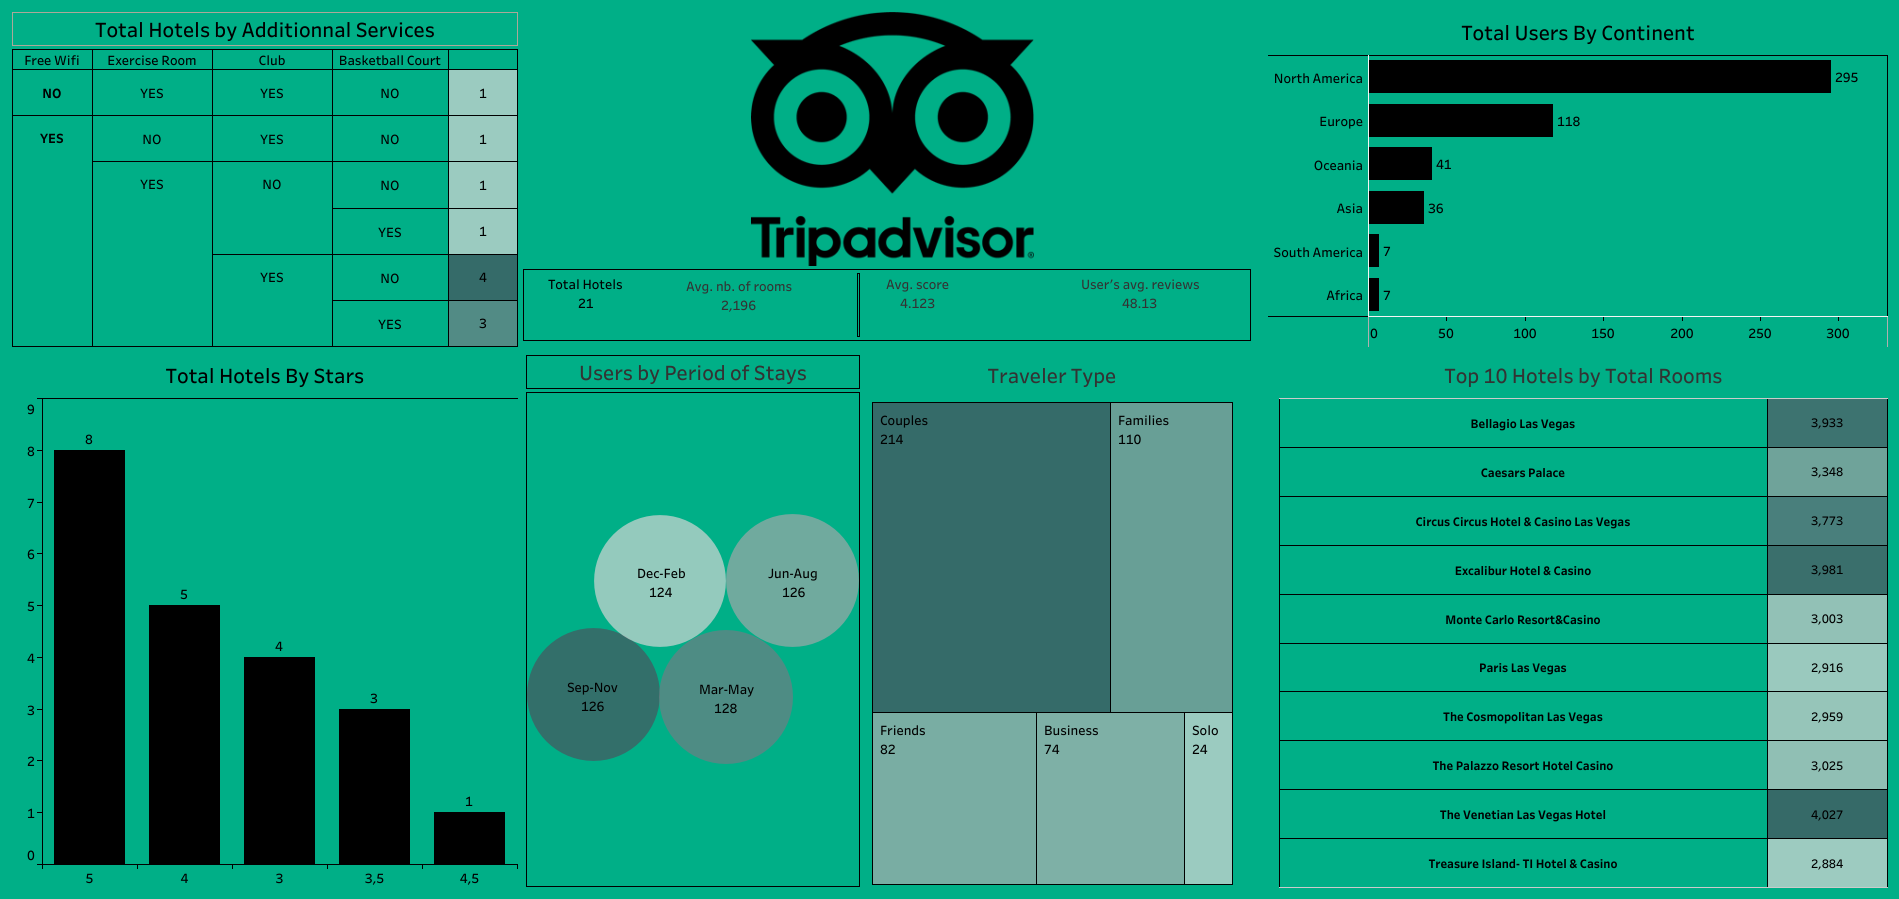 Travel & Tourism
Being a big traveler I have created an average statistics of travels with TripAdvisor and the most users that use it with the different hotels
View Dashboard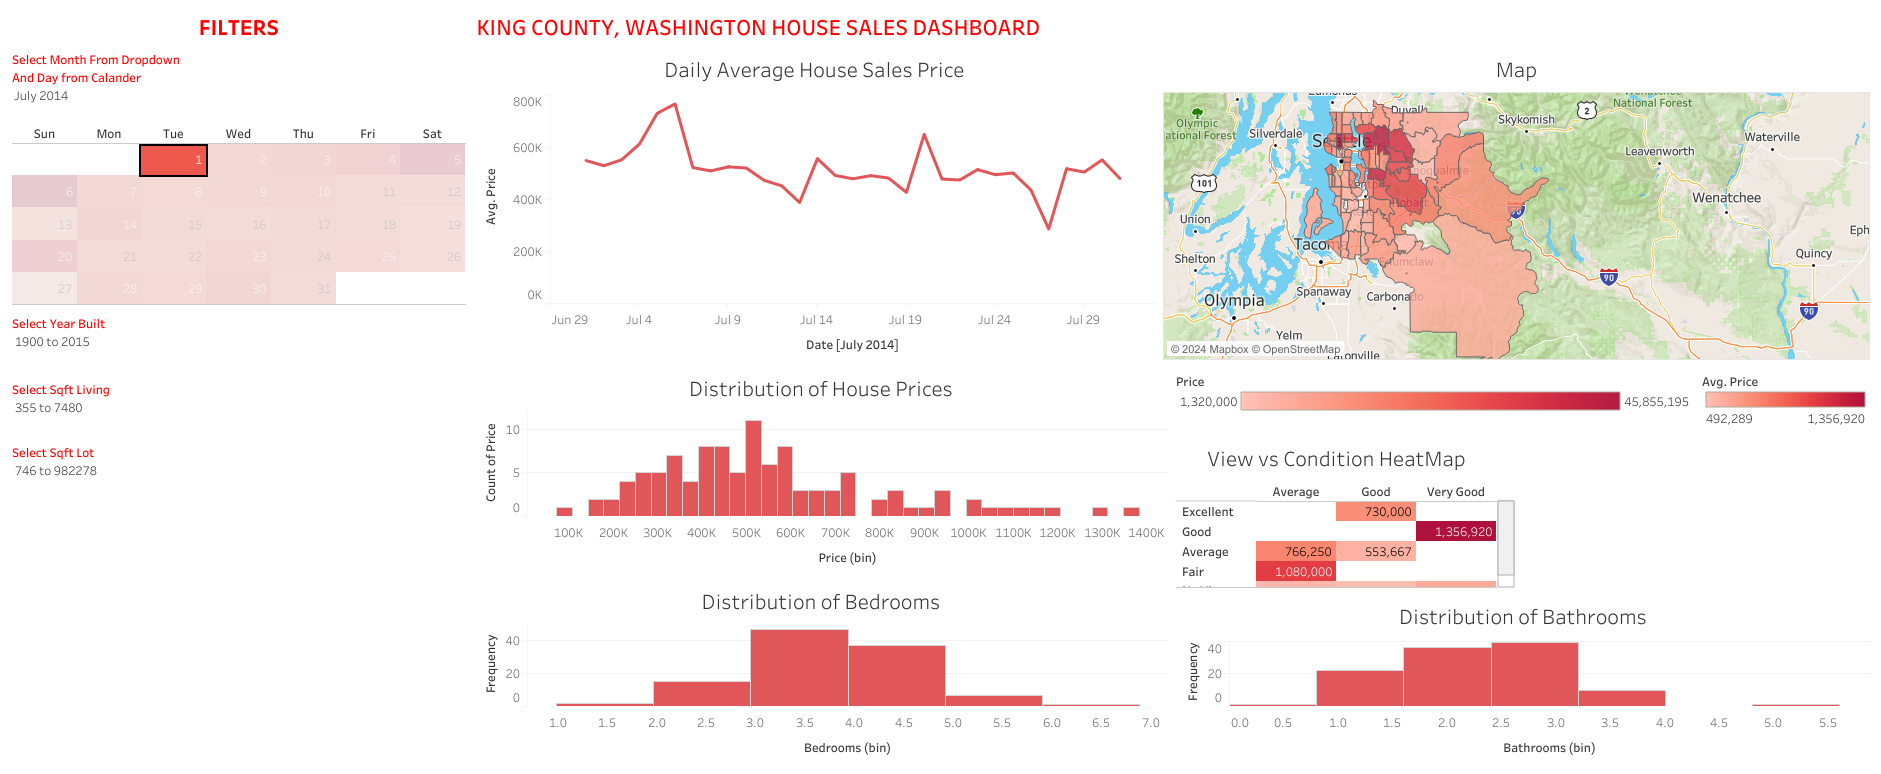 Real Estate
In King County Washington, created a filtter to determine prices of the market with the the different distrubutions of Bedrooms/Bathrooms .
View Dashboard